Direct Comparison of DNA versus mRNA on the Efficiency of Induced Pluripotent Stem Cells Generation from Human Primary Fibroblasts
Sandra Aurora Telpalo- Carpio, Francisco Díaz-Mitoma, Jorge Eugenio Moreno- Cuevas and Jose Manuel Aguilar-Yanez
DOI10.21767/2573-5365.100013
Sandra Aurora Telpalo-Carpio1,3,Francisco Díaz-Mitoma1,Jorge Eugenio Moreno-Cuevas2 and Jose Manuel Aguilar-Yanez1,3*
1Advanced Medical Research Institute ofCanada (AMRIC) 41 Ramsey Lake Road,Sudbury, Ontario, Canada
2Center for Health Innovation andTransfer (CITES), Tecnológico deMonterrey Av. Morones Prieto 3000 Pte,Col. Los Doctores, Monterrey, NuevoLeón, México
3Center of Biotechnology FEMSA,Tecnológico de Monterrey Av. EugenioGarza Sada 2501 Sur, Col. Tecnológico,Monterrey, Nuevo León, México
- *Corresponding Author:
- José Manuel Aguilar-Yáñez
Advanced Medical Research Institute of Canada (AMRIC), 41 Ramsey Lake Road,Sudbury, Ontario, P3E5J1, Canada
Tel: +52 (81) 8358 2000 ext. 5060
Fax: +52 (81) 8328-4136
Email: aguilar.manuel@itesm.mx
Received date: March 18, 2016; Accepted date: March 28, 2015; Published date: March 31, 2016
Citation: Telpalo-Carpio SA, Díaz-Mitoma F,Moreno-Cuevas JE, et al. Direct Comparison of DNA versus mRNA on the Efficiency of Induced Pluripotent Stem Cells Generationfrom Human Primary Fibroblasts. Cell Mol Med. 2016, 2:1.
Abstract
Induction of pluripotency in somatic cells has opened a brand new spectrum on patient-specific stem cell therapies, therefore several approaches seek the optimization of the existing dedifferentiation processes. DNA and mRNA have been used to induce cells using different strategies, from diverse sets of pluripotency induction genes to variations of their delivery method. In this work we present a direct comparison between circular and linear DNA, as well as mRNA, capability to dedifferentiate human primary fibroblasts.
Keywords
Induced pluripotent stem cells; Primary human fibroblasts; MRNA; DNA; Non-integrative
Introduction
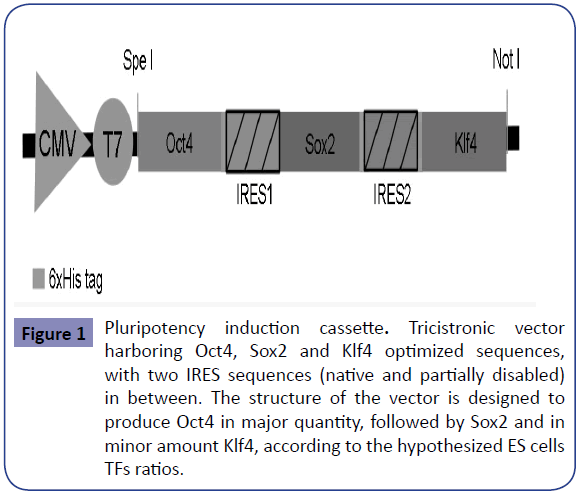
The induction of pluripotency with defined transcription factors (TFs) in somatic cells was first proven by Takahashi and Yamanaka [1]. Distinct modifications to the original scheme seek the optimization of the procedure; within them are the genes used and the method to deliver them into the cell, as well as the cell type selected for induction. The classic dedifferentiation set includes Oct4, Sox2, Klf4 and c-Myc (OSKM). However, many different combinations have been analyzed [2-11]. Even though efficiencies are still low, promising results have been obtained with the Oct4, Sox2 and Klf4 (OSK) combination [6,12,13]. It is known that TFs stoichiometry influences dedifferentiation efficiency as well as the epigenetic and biological properties of the generated iPSCs [14-16], nonetheless they are usually delivered individually. This makes difficult to control the quantity of each gene entering the cell and thus the ratio at which each could be transcribed and translated, and makes almost impossible to guarantee that every successfully transfected cell receives all the desired genes. To assure that all the required genes enter the cell, the use of polycistronic vectors is explored [15,17-20]. Also, TFs delivering is commonly done via retroviruses or lenti viruses [21- 25], deriving in transgenes’ integration to the cell genome, hence non-integrative alternatives are being explored [11,26-30], Even though different cell types have been evaluated, the prevailing human cells used are fibroblasts [2,3,7,21,31,32] given their practicability of obtaining from donors and good dedifferentiation rates. Accordingly to the hypothesis that there is an optimal TFs intracellular ratio that might increase pluripotency induction efficiency, as each is expressed differently on embryonic and adult human stem cells [31,33], we designed a tricistronic vector harboring OSK. The set of genes is in between two Internal ribosome entry sites (IRES) from the Encephalomyocarditis virus (EMCV) [34], that working together with the 5’ translation initiation site, allow simultaneous translation of the three TFs from a single mRNA [35-37] (Figure 1 and Supplementary File 1). We selected two different sequences that enable translation of each TF in different amount. The proposed structure of our vector (pFAPIS) is designed to produce Oct4 in higher quantity than Sox2, being Klf4 the lowest. Human primary fibroblasts were transfected with circular DNA, linear DNA, and mRNA to compare their total pluripotency induction efficiency. Alkaline Phosphatase (AP) staining was used to determine dedifferentiation capability, as it is one of the first pluripotency signs and an endpoint assay to monitor undifferentiated cells with self-renewal potential [38]. Other classic pluripotency markers were also detected using RTPCR and flow cytometry, although it is known that not all the iPSC markers can be seen in the first days of dedifferentiation [39]. As is has been previously proved that OSK combination is sufficient to successfully induce pluripotency on human fibroblasts [6,12,13] the aim of this work is only to compare the efficiencies obtained with the three proposed induction methods, and demonstrate that IRES structures in between the genes arrangement allows different levels of protein production in either version of ribonucleic acid used. Then, cells that are easily obtained from patients and have reliable dedifferentiation capabilities are desirable for a non-invasive patient-specific approach. Thereby, the use of a set without the oncogene eliminates the risks of its reactivation, and the use of a polycistronic arrangement thats makes possible to control TFs stoichiometry, are advantageous features for clinical applications.
Figure 1: Pluripotency induction cassette. Tricistronic vector harboring Oct4, Sox2 and Klf4 optimized sequences, with two IRES sequences (native and partially disabled) in between. The structure of the vector is designed to produce Oct4 in major quantity, followed by Sox2 and in minor amount Klf4, according to the hypothesized ES cells TFs ratios.
Methods
Vector construction
Oct4 [GenBank:NM002701.4], Sox2 [GenBank:NM003106.3] and Klf4 [GenBank:NM004235.4] sequences were optimized for human expression (DNA 2.0; California, USA). Each factor harbors a 6xHis tag to allow their identification with the same antibody. In between the TFs, two IRES sequences were included: IRES1 and IRES2 that correspond to wild type (MPS1-ECAT) and partially disabled (MPS1-ECAT811) [34]. The synthetic cassette was cloned into pTracer CMV/Bsd (Life Techologies; New York, USA).
DNA production
Top10F E. coli strain was transformed with pFAPIS. Cells were grown on LB broth (Difco; Maryland, USA) plus 150 ∝g/ mL carbenicillin (Sigma-Aldrich; Missouri, USA). DNA was purified with PureYield Plasmid Maxiprep System (Promega; Wisconsin, USA) and linearized using SapI (New England Biolabs; Massachusetts, USA).
In vitro transcription
Ribomax Large Scale Production System T7 (Promega) was utilized for mRNA obtaining. The reaction product was cleaned using NAP-5 chromatographic columns (GE Healthcare, UK).
Cell culture
Human primary fibroblasts (ATCC; Virgina, USA) were grown on DMEM-F12 (Gibco; New York, USA) with 10% fetal bovine serum (FBS) (Gibco) and 1% Penicillin-Streptomycin (Pen-Stp) (Gibco). Derived iPSCs were grown with PluriSTEM Human ES/ iPS (Millipore; Massachusetts, USA) on Matrigel (Corning; New York, USA). iPS cells were passaged using gentle cell dissociation reagent (Gibco). Both cell lines were maintained at 37°C, 5% CO2.
Pluripotency induction
Fibroblasts were seeded at 4 × 10⁵ cells/mL and transfected with Transit-2020 (MirusBio; Wisconsin, USA) using 1 ∝g of DNA or 0.2 ∝g of mRNA per mL of cell culture. When using DNA a single initial transfection was done (day 0), when using mRNA three total deliveries were given on days zero, two and four. In either case, cells were transferred to a Matrigel coated plate at day 5. Untransfected fibroblasts and transfected using pTracer CMV/ Bsd backbone as mock plasmid (L1) and the same backbone with another non-relevant insert (pOne) were used as negative controls. They were transfected and maintained under the same conditions as the ones transfected with pFAPIS. Transfection efficiency was determined via fluorescent cells counting in all DNA cases. Transfection efficiency using mRNA could not be calculated.
Colony appearance
Colonies could be seen as high-density cell arrangements with the naked eye, four days after the first transfection using mRNA induction and since day nine using either version of DNA. They were analyzed using IX2-SLP microscope (Olympus; Ontario, Canada) with a 10X objective.
Alkaline phosphatase staining
mRNA transfected cells were analyzed at day 5 post-initial transfection and DNA transfected cells on day thirteen post-induction using the Alkaline Phosphatase Staining Kit (Millipore). AP positive structures were visible to the naked eye and analyzed using the DM IL microscope (Leica; Ontario, Canada).
Calculation of reprogramming efficiency
Image J software (NIH; Maryland, USA) was used to determine the colony count. Images for analysis were obtained before and after AP staining using the Perfection V370 scanner (Epson).
Flow cytometry
iPS Cell Characterization Kit (Millipore) was used to identify surface and intracellular stem cells markers, using Gallios Flow Cytometer (Beckman Coulter; Ontario, Canada), utilizing circular DNA induced cells at day 13 post-transfection.
RT-PCR
RNA extraction was performed at day 13 post-induction on cells transfected with circular DNA using Genelute mammalian total RNA (Sigma). OneStep RT-PCR kit (Qiagen; Maryland,USA) was utilized to execute the reaction. Primers for Oct4, Sox2 and Nanog were used (Supplementary Table 1). 1% agarose gel electrophoresis permitted reaction products analysis.
Protein extraction
At day thirteen post-transfection with circular DNA, cells were harvested according to Tansey [40]. In mRNA transfected cells case, two successive mRNA transfections were done 12 hours apart with sample collection 18 hours after the first delivery. The same collection protocol was used. Untransfected primary fibroblasts were used as negative control, and processed identically.
SDS-PAGE
Cell extracts were ran in a 10% SDS-PAGE [41], at 120 V for 1:20 hrs. Gels were loaded with 37 ∝g of total protein of the corresponding cell extracts in all cases.
Western blotting
An HRP labeled anti-6xHis antibody (Roche; Québec, Canada) in a 1:500 dilution was used. SDS-PAGE proteins were transferred onto a PVDF membrane (Millipore) using the Fast Semi-dry Blotter (Thermo Scientific) for 35 minutes at 25 volts. Detection was made with Clarity Western ECL Substrate (BioRad Laboratories; California, USA) and an UltraCruz Autoradiography Film (Santa Cruz Biotechnology; Texas, USA). Total protein from untransformed fibroblasts, and circular DNA and mRNA induced cells was tested. A known molecular weight 6xHis-tagged protein was used as molecular weight marker.
Statistical analysis
Two-tailed Student’s t-tests were performed with StatPlus Software (Analyst Soft) using data from circular and linear DNA induced groups, and from circular DNA and mRNA induced groups. One-way ANOVA enabled comparison of the three groups among them. P-values <0.05 were considered statistically significant.
Results
iPSCs induction using DNA and mRNA
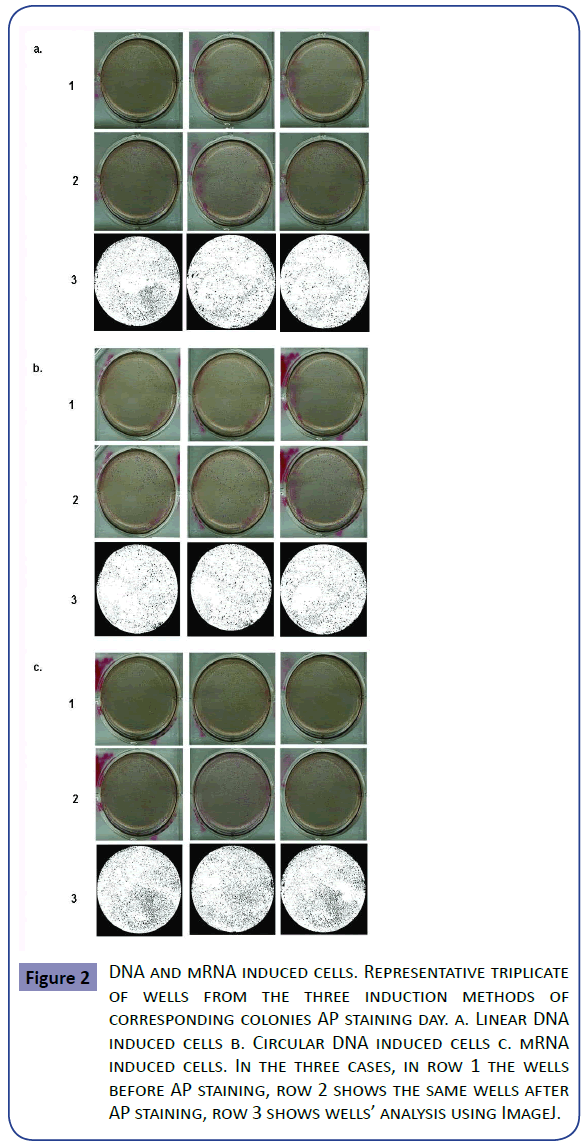
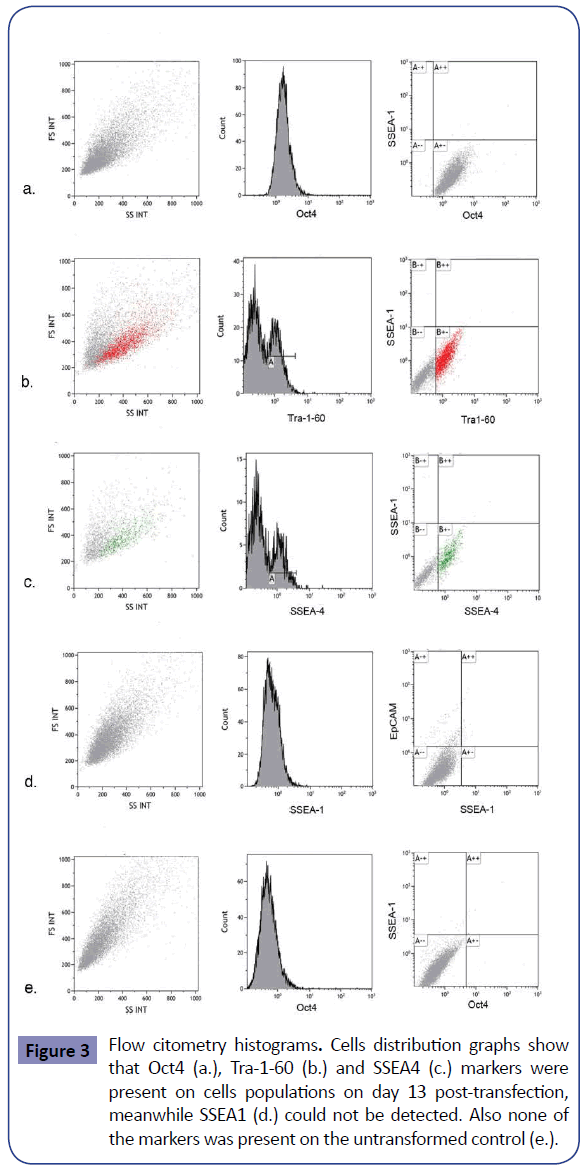
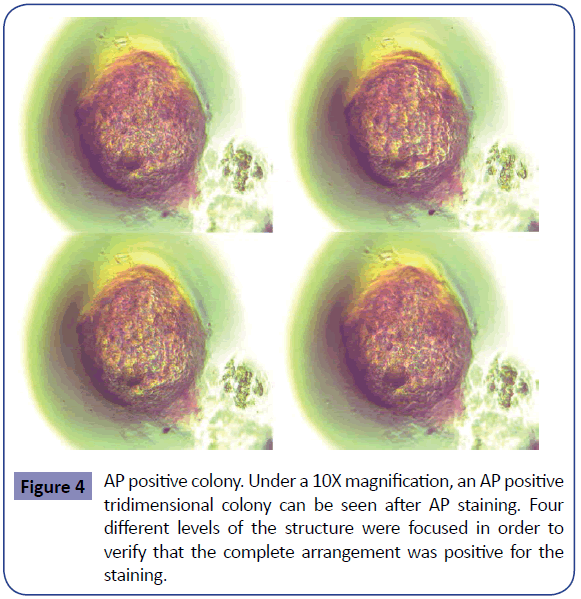
When inducing pluripotency with DNA (Figures 2a and 2b) no time difference in colony appearance was seen with either of the two versions. In both cases AP staining was positive at day thirteen post-transfection and morphological iPSC characteristics appeared with no time difference between them. AP positive cell groups yield was slightly different, when induction was done with the linear vector an average of 1706 colonies per well were obtained, whereas when using circular DNA the average was 2109, conferring a dedifferentiation efficiency of 0.42 and 0.52% respectively. In order to verify that the AP positive colonies were also expressing other classic pluripotency markers, flow cytometry was performed using circular DNA transfected cells. Oct4, Tra-1- 60 and SSEA4 positive cells were found, meanwhile SSEA1 was not detected. On untransformed cells no markers were found so it can be said that the generated cells present pluripotency potential (Figure 3). In the same fashion, an RT-PCR was run using Oct4, Sox2 and NANOG primers. Bands corresponding to the three expected amplicons sizes were visualized, in contrast to the negative control (untransformed fibroblasts) lane, which did not show any amplification product (Supplementary Figure S2). A t-test analysis was performed between circular and linear DNA and the difference among them were statistically significant; therefore the first was used to run comparison experiments with mRNA induction. In the case of mRNA induction, colonies were seen since day four post-transfection with AP positive cell clusters at day five post-induction (Figures 2c and Supplementary Figure S1). mRNA yields were on average 3217 colonies, which corresponds to an efficiency of 0.8%. Negative control cells were unable to survive after 8 days from transfection (Supplementary Figure S3). Consequently, we decided that cell survival along with positive AP staining and Nanog expression was sufficient to presume that the identified cells showed pluripotent cells early characteristics and potential. DNA and mRNA induced cells behaved differently both in time of colonies appearance and in induction efficiency (Supplementary Table 2). The latter was confirmed to be statistically significant after a t-test was run between both inductions data and an ANOVA demonstrated that none of the treatments was similar among each other. Thus, it can be said that induction done with mRNA resulted 35% more efficient than the one with circular DNA, and the last is 19% more efficient than its linear counterpart. Also, both types of induction AP positive structures were analyzed under a 10X lens and they showed similar characteristics (Figure 4).
Figure 2: DNA and mRNA induced cells. Representative triplicate of wells from the three induction methods of corresponding colonies AP staining day. a. Linear DNA induced cells b. Circular DNA induced cells c. mRNA induced cells. In the three cases, in row 1 the wells before AP staining, row 2 shows the same wells after AP staining, row 3 shows wells’ analysis using ImageJ.
TFs ratio production analysis
In order to determine if our hypothesis of TFs production ratio was being fulfilled, we designed experiments that enable us to visualize each transcription factor at protein production level. Protein samples of circular DNA and mRNA induced cells were processed in Western Blot along with a molecular weight (MW) marker (43.6 kD). In both samples, three bands in the calculated MW of each TF: Oct4 of 39.3 kD, Sox2 of 35.1 kD and Klf4 of 51.8 kD, could be identified. In opposition, on the negative control (Untransfected fibroblasts) lane, no proteins could be detected (Supplementary Figure S4). Each TF band presented different density that was alike in both types of induction, being the densest the one that represents Oct4, followed by Sox2 and then Klf4.
Discussion
When fibroblasts were transformed using DNA, colonies were visible later than the ones transfected with mRNA, this may due to the fact that when the latter was delivered, it was ready to be translated. While DNA has to integrate to the cell’s genome to be transcribed and translated, which delays protein availability. Efficiency differences could be consequence of the mRNA available for translation. When using DNA, its integration to the cells’ genome is not always appropriate due to cell’s vector random linearization and insertion direction, so not all integrated exogenous DNA would codify correctly for the proteins needed, hence the overall protein production efficiency decreases and ratios might not be the ones desired. The results obtained indicated that mRNA induction is faster and more efficient than the results obtained using DNA. As mRNA gave better outcomes than DNA, we contrasted those results with others with similar scope, in order to identify the strengths of this method over others previously reported. Comparing our findings with those from Warren et al. the method here shown shows some betterment. First, we discarded c-Myc, eliminating its risk of reactivation. Second, they used modified bases to synthesize the mRNA used, while we utilized regular nitrogen bases. They also used interferon inhibitor to overcome innate antiviral responses, however it has been reported that its reactivation enhances iPSCs generation [42], so we did not inhibit this natural response. With the technology here reported, we were able to see ES-like colonies 16 days before them with only three mRNA transfections of 1 μg each, in opposition to their 16 transfections of 600 ng each. Nonetheless our efficiency is lower than theirs, which might be correlated with the minor efficiencies reported when using OSK. Yoshioka et al. reported the utilization of OSKM in a single RNA replicon and B18R as innate immune response blocker. Utilizing up to five transfections, with efficiency around 0.025%, they obtained AP positive stained colonies in between days 25 and 30. In this case, the results here reported exhibit an efficiency 32X greater and a 4X times faster induction. Rais et al. used three rounds of OSKM and LIN28 mRNA transfections, ROCK inhibitor and Mbd3 siRNA, reporting pluripotent cells at day 8. We are able to generate AP positive colonies at day five post-transfection, using only three mRNA deliveries, without any modifications to the cells internal environment and with a simpler group of induction genes. Thereby, it can be said that the technology here presented indicates that a single mRNA derived from a smaller set of dedifferentiation genes, is able to drive efficient pluripotency induction. The elimination of c-Myc fends off its reactivation, and as a non-integrative method is used, the integration-derived safety issues of the generated cells are overcome. These observations lead to the conclusion that our vector (on both DNA and mRNA versions) is able to drive the cell to produce the TFs in the proportion that was hypothesized, generating a stoichiometry that would correspond to human embryonic and adult stem cells distinctive concentrations, hence probably facilitating and hastening the dedifferentiation process. It can also be noticed that band intensities differ between DNA and mRNA lanes, this might be consequence of the mRNA availability for translation, as it could be greater in the latter than in the first. Together with the safety benefits of the nonintegration given by mRNA, the reduction of TFs number that simplifies cells’ external stimulus, and the ability to control the protein production ratios by the use of a single messenger, the system here presented exhibits some characteristics that might help improve pluripotency induction existing techniques. Even though previous evidence demonstrated that OSK is able to generate pluripotent cells, there are still tests to run in order to assure that the generated cells have all the properties that make them iPSC (such as the three germ layers generation capabilities and differentiation to specific cell lines potential), nevertheless the data obtained so far suggests that the proposed OSK vector that permits stoichiometry control is able to generate cells that show pluripotent characteristics and potential. Thereby, it can be stated that induction can be done with the same set of genes using two different procedures that enable protein level production control. As expected, differences between DNA and mRNA induced cells were seen. mRNA showed 35% better yields and almost half the time of AP positive cells emergency, when compared to circular DNA approach. So, in addition to the nonintegration benefits intrinsic to the mRNA methodology, the aforementioned features may help to develop techniques with better qualities that could aid drive this technology outside the bench.
Acknowledgments
Thanks to Consejo Nacional de Ciencia y Tecnología (CONACyT) for the support given to the 296956 CVU holder. M.Sc. Nya Fraleigh and Dr. Justo Pérez for the facilities given for experiments completion. M.Sc. BongMin Bae and Dr. Sergio Ángel García Echauri for the proof reading of the manuscript. Vaccine Group at AMRIC and Cell Therapy and Regenerative Medicine Endowment at ITESM for the help given during this project.
Conflict of interests
The authors acknowledge that there is no conflict of interests.
References
- Takahashi K,Yamanaka S (2006) Induction of pluripotent stem cells from mouse embryonic and adult fibroblast cultures by defined factors. Cell: 126.
- Lowry WE, Richter L, Yachechko R, Pyle AD, Tchieu J (2008) Generation of human induced pluripotent stem cells from dermal fibroblasts. PNAS 105: 2882-2888.
- Maherali N, Alfedt T, Rigamonti A, Utikal J,Cowan C (2008) A high-efficiency system for the generation and study of human induced pluripotent stem cells. Cell Stem Cel : 340-345.
- Feng B, Jiang J, Kraus P, Ng JH, Heng JC (2009) Reprogramming of fibroblasts into induced pluripotent stem cells with orphan nuclear receptor Esrrb. Nat Cell Biol 11: 197-203.
- Haase A, Olmer R, Schwanke K, Wunderlich S, Merkert S (2009) Generation of induced pluripotent stem cells from human cord blood. Cell Stem Cell 5: 434-441.
- Li W, Wei W, Zhu S, Zhu J, Shi Y (2009) Generation of rat and human induced pluripotent stem cells bygenetic reprogramming and chemical inhibitors. Cell Stem Cell 4:16-19.
- Yu J, Hu K, Smuga-Otto K,Tian S, Stewart R (2009) Human induced pluripotent stem cells free of vector and transgene sequences. Science 324:797-801.
- Chou BK, Mali P, Huang X, Ye Z, Dowey SN (2011) Efficient human iPS cell derivation by a non-integrating plasmid from blood cells with unique epigenetic and gene expression signatures. Cell Res 21: 518-529.
- Okita K, Matsumura Y, Sato Y, Okada A, Morizane A (2011) A more efficient method to generate integration-free human iPS cells. Nat Methods 8:409-412.
- Yu J, Chau KF, Vodyanik MA, Jiang J, Jiang Y (2011) Efficient feeder-free episomal reprogramming with small molecules. PLoS One 6: e17557.
- Yoshioka N, Gros E, Li HR, Kumar S, Deacon DC (2013) Efficient generation of human iPSCs by a synthetic self-replicative RNA. Cell Stem Cell 13: 246-254.
- Nakagawa M, Koyanagi M, Tanabe K (2008) Generation of iPS cells without Myc from mouse and human fibroblasts. Nature Biotechnology 26:101-106.
- Chang MY, Kim D,Kim CH,Kang HC, Yang E (2010) Direct reprogramming of rat neural precursor cells and fibroblasts into pluripotent stem cells. PLoS One 5:e9838.
- Papapetrou EP, Tomishima MJ, Chambers SM, Mica Y, Reed E (2009) Stoichiometric and temporal requirements of Oct4, Sox2, Klf4, and c-Myc expression for efficient human iPSC induction and differentiation. Proc Natl Acad Sci U S A106: 12759-12764.
- Carey BW, Markoulaki S, Hanna JH, Faddah DA, Buganim Y (2011) Reprogramming factor stoichiometry influences the epigenetic state and biological properties of induced pluripotent stem cells. Cell Stem Cell 9: 588-598.
- Tiemann U, Sgodda M, Warlich E, Ballmaier M, Scholer HR (2011) Optimal reprogramming factor stoichiometry increases colony numbers and affects molecular characteristics of murine induced pluripotent stem cells. Cytometry A 79: 426-435.
- Carey BW, Markoulaki S,Hanna J, Saha K, Gao Q (2009) Reprogramming of murine and human somatic cells using a single polycistronic vector. Proc Natl Acad Sci U S A 106: 157-162.
- Gonzalez F, Barragan Monasterio M,Tiscornia G, Montserrat Pulido N, Vassena R(2009) Generation of mouse-induced pluripotent stem cells by transient expression of a single nonviral polycistronic vector. Proc Natl Acad Sci USA 106:8918-8922.
- Kaji K, Norrby K, Paca A, Mileikovsky M, Mohseni P(2009) Virus free induction of pluripotency and subsequent excision of reprogramming factors. Nature 458: 771-775.
- Zhang Z, Gao Y, Gordon A,Wang ZZ, Qian Z (2011)Efficient generation of fully reprogrammed human iPS cells via polycistronic retroviral vector and a new cocktail of chemical compounds. PLoS One 6:e26592.
- Takahashi K,Yamanaka S (2007) Induction of pluripotent stem cells from adult human fibroblasts by defined factors. Cell 126: 663-676.
- Brambrink T, Foreman R, Welstead GG, Lengner CJ, Wernig M(2008) Sequential expression of pluripotency markers during direct reprogramming of mouse somatic cells. Cell Stem Cell 2:151-159.
- Wernig M, Lengner CJ, Hanna J,Lodato MA, Steine E(2008) A drug-inducible transgenic system for direct reprogramming of multiple somatic cell types. Nat Biotechnol 26:916-924.
- Aasen T, Raya A, Barrero M, Garreta E, Consiglio A (2008) Efficient and rapid generation of induced pluripotent stem cells from human keratinocytes. Nature Biotechnology 26: 1276-1284.
- Rais Y, Zviran A, Geula S, Gafni O, Chomsky E (2013) Deterministic direct reprogramming of somatic cells to pluripotency. Nature 502: 65-70.
- Stadtfeld M, Nagaya M, Utikal J, Weir G, Hochendlinger K (2008) Induced pluripotent stem cells generated without viral integration. Science 322.
- Zhou H, Wu S, Joo JY, Zhu S, Han D(2009) Generation of induced pluripotent stem cells using recombinant proteins. Cell Stem Cell 4: 381-384.
- Woltjen K, Michael IP, Mohseni P, Desai R, Mileikovsky M (2009)piggyBac transposition reprograms fibroblasts to induced pluripotent stem cells. Nature 458: 766-770.
- Warren L, Manos PD, Ahfeldt T,Loh YH,Li H(2010) Highly efficient reprogramming to pluripotency and directed differentiation of human cells with synthetic modified mRNA. Cell Stem Cell 7: 618-630.
- Ban H, Nishishita N, Fusaki N, Tabata T, Saeki K (2011) Efficient generation of transgene-free human induced pluripotent stem cells (iPSCs) by temperature-sensitive Sendai virus vectors. Proc Natl Acad Sci U S A108: 14234-14239.
- Chang CW, Lai YS, PawlikKM, Liu K, Sun CW(2009) Polycistronic lentiviral vector for "hit and run" reprogramming of adult skin fibroblasts to induced pluripotent stem cells. Stem Cells 27:1042-1049.
- Zhou W , Freed CR (2009) Adenoviral gene delivery can reprogram human fibroblasts to induced pluripotent stem cells. Stem Cells 27:2667-2674.
- Brown ME, Rondon E, RajeshD, MackA, LewisR (2010) Derivation of induced pluripotent stem cells from human peripheral blood T lymphocytes. PLoS One 5: e11373.
- Jang SK , Wimmer E (1990) Cap-independent translation of encephalomyocarditis virus RNA: structural elements of the internal ribosomal entry site and involvement of a cellular 57-kD RNA-binding protein. Genes Dev 4: 1560-1572.
- Martinez-Salas E, Ramos R,LafuenteE,Lopez de QuintoS(2001) Functional interactions in internal translation initiation directed by viral and cellular IRES elements. J Gen Virol82: 973-984.
- Stoneley M, Willis AE(2004) Cellular internal ribosome entry segments: structures, trans-acting factors and regulation of gene expression. Oncogene 23: 3200-3207.
- Fernandez N, Garcia-SacristanA, RamajoJ, BrionesC, Martinez-SalasE (2011)Structural analysis provides insights into the modular organization of picornavirus IRES. Virology 409:251-261.
- O'Connor MD, KardelMD, IosfinaI, YoussefD, LuM, (2008) Alkaline phosphatase-positive colony formation is a sensitive, specific, and quantitative indicator of undifferentiated human embryonic stem cells. Stem Cells 26: 1109-1116.
- Lujan E, ZunderER, NgYH, GoronzyIN, NolanGP(2015) Early reprogramming regulators identified by prospective isolation and mass cytometry. Nature.
- Tansey WP(2006) Freeze-thaw lysis for extraction of proteins from Mammalian cells. CSH Protoc.
- Laemmli UK(1970) Cleavage of structural proteins during the assembly of the head of bacteriophage T4. Nature 227: 680-685.
- Lee J, SayedN, HunterA, AuKF, WongWH (2012) Activation of innate immunity is required for efficient nuclear reprogramming. Cell 151: 547-558.
Open Access Journals
- Aquaculture & Veterinary Science
- Chemistry & Chemical Sciences
- Clinical Sciences
- Engineering
- General Science
- Genetics & Molecular Biology
- Health Care & Nursing
- Immunology & Microbiology
- Materials Science
- Mathematics & Physics
- Medical Sciences
- Neurology & Psychiatry
- Oncology & Cancer Science
- Pharmaceutical Sciences
